Case Study
Revenue Intelligence • Reporting • CRM Data • Business Analytics
Growing contractors often have plenty of business data—but limited visibility.
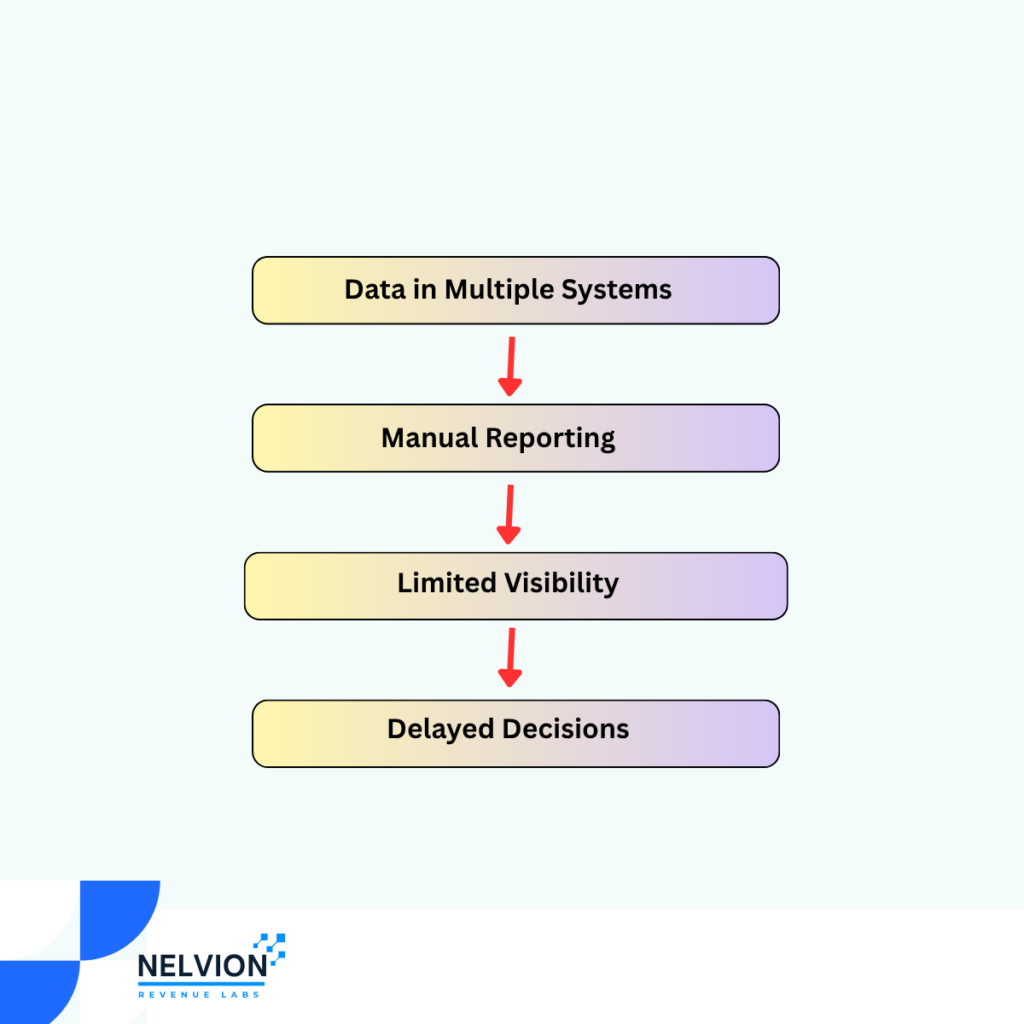
Leads may exist inside a CRM, estimates in another system, sales activity in email or spreadsheets, and revenue information somewhere else.
The result is a business owner who has information but cannot easily see the full picture.
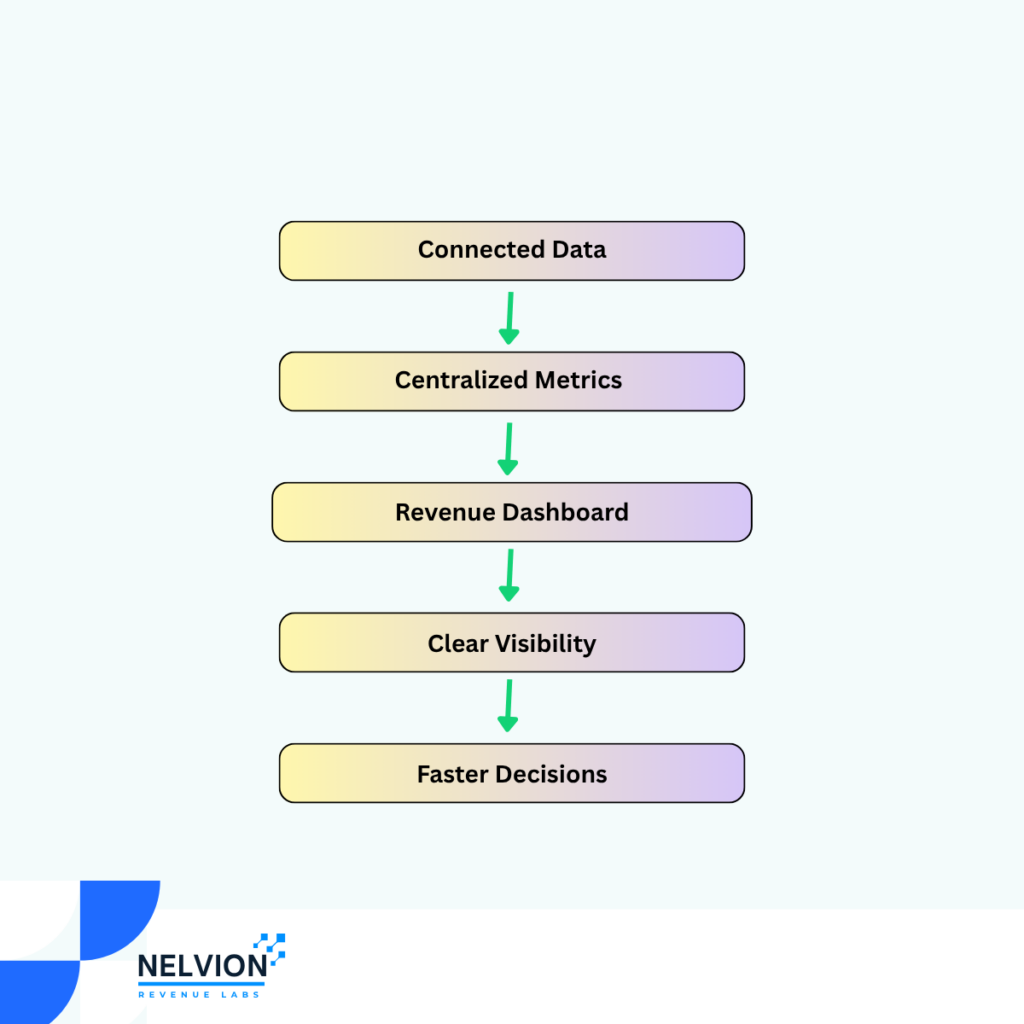
This project demonstrates a centralized Contractor Revenue Dashboard designed to bring key sales and revenue metrics into one view.
The business had sales information distributed across multiple systems and sources.
Management needed an easier way to understand:
Without centralized reporting, answering these questions required manually checking different systems.
The goal was to create a simple management dashboard that turns raw CRM and sales information into actionable visibility.
The dashboard was designed to answer five key questions:
How many opportunities do we have?
How much potential revenue is in the pipeline?
Where are opportunities getting stuck?
Which lead sources are performing?
How is the sales process performing?
Designed an Executive KPI Dashboard that consolidates CRM and operational data into interactive dashboards, providing leadership with real-time insights into sales, revenue, pipeline performance, and operational activities.
The dashboard automatically updates as new business data is captured, eliminating manual reporting while supporting strategic decision-making.
Track:
Track:
Monitor:
Track:
Understand where opportunities are coming from.
For example:
Website
Referrals
Phone
Other Sources
This allows management to compare lead volume with actual sales performance.
Where multiple salespeople are involved, the dashboard can provide visibility into:
CRM & Business Data
↓
Data Processing
↓
Revenue Metrics
↓
Dashboard
↓
Management Decisions
The dashboard doesn’t simply display numbers.
It creates a common source of visibility for decision-making.
Potential implementation:
HubSpot / GoHighLevel / Salesforce
CRM and sales data
Airtable / Google Sheets
Supporting data where required
Looker Studio
Dashboard and visualization
Make / Zapier
Data synchronization and workflow automation
The technology can be adapted to the client’s existing systems.
The dashboard is designed to help management:
Understand how many opportunities exist and their potential value.
See where opportunities are accumulating or becoming inactive.
Compare lead volume against actual sales performance.
Understand how the sales process is performing over time.
Replace manual reporting with a centralized view of key metrics.
A CRM can contain thousands of records without giving management a clear understanding of what is happening.
The purpose of revenue reporting is to turn that data into visibility, accountability, and better decisions.
Do you know where your leads, opportunities, and revenue are getting stuck?
Revenue Operations & Business Systems for Growing Home Service Businesses
Revenue Operations • Business Automation • Revenue Intelligence • AI Enhancement