

Skip to content

Case Study 06

Executive KPI Dashboard

Case Study

Designed an Executive KPI Dashboard that consolidates CRM and operational data into interactive dashboards, providing leadership with real-time insights into sales, revenue, pipeline performance, and operational activities.

Executive Summary

Business leaders need timely, accurate information to make informed decisions. However, many service businesses rely on spreadsheets or disconnected reports, making it difficult to monitor sales performance, forecast revenue, and identify operational bottlenecks.

The Executive KPI Dashboard consolidates key business metrics into a single, real-time reporting system. By integrating CRM and operational data, business owners and managers gain visibility into sales performance, pipeline health, revenue trends, and team activity—enabling faster, data-driven decisions.

Business Problem

Many growing service businesses lack a centralized reporting system.

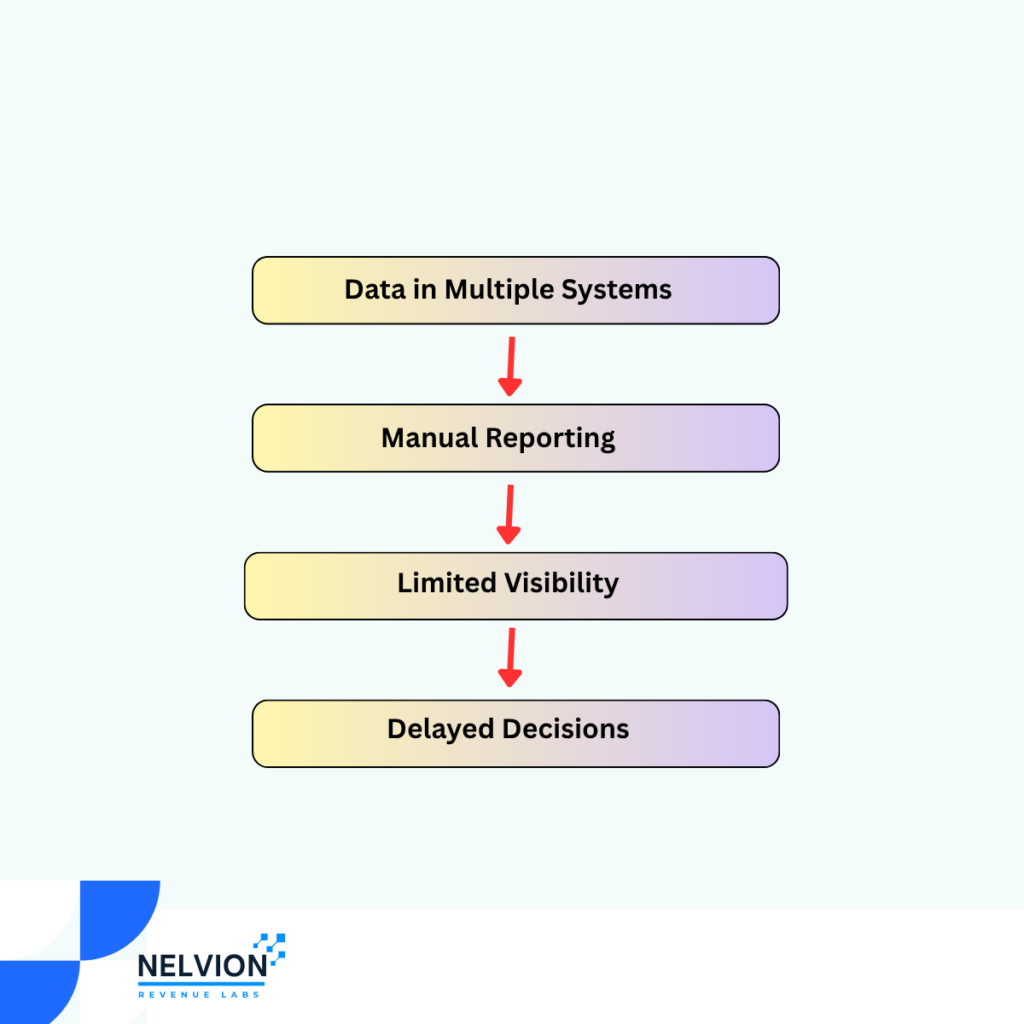
Leadership often spends hours compiling reports manually while still lacking visibility into business performance.

Key Challenges

  • Disconnected reporting systems
  • Limited pipeline visibility
  • Manual report preparation
  • Inaccurate forecasting
  • Difficulty tracking KPIs
  • Delayed decision-making

Business Risks

  • Poor visibility into revenue performance
  • Missed sales opportunities
  • Inaccurate forecasting
  • Slow management decisions
  • Inefficient sales management
  • Limited accountability

Solution

Designed an Executive KPI Dashboard that consolidates CRM and operational data into interactive dashboards, providing leadership with real-time insights into sales, revenue, pipeline performance, and operational activities.

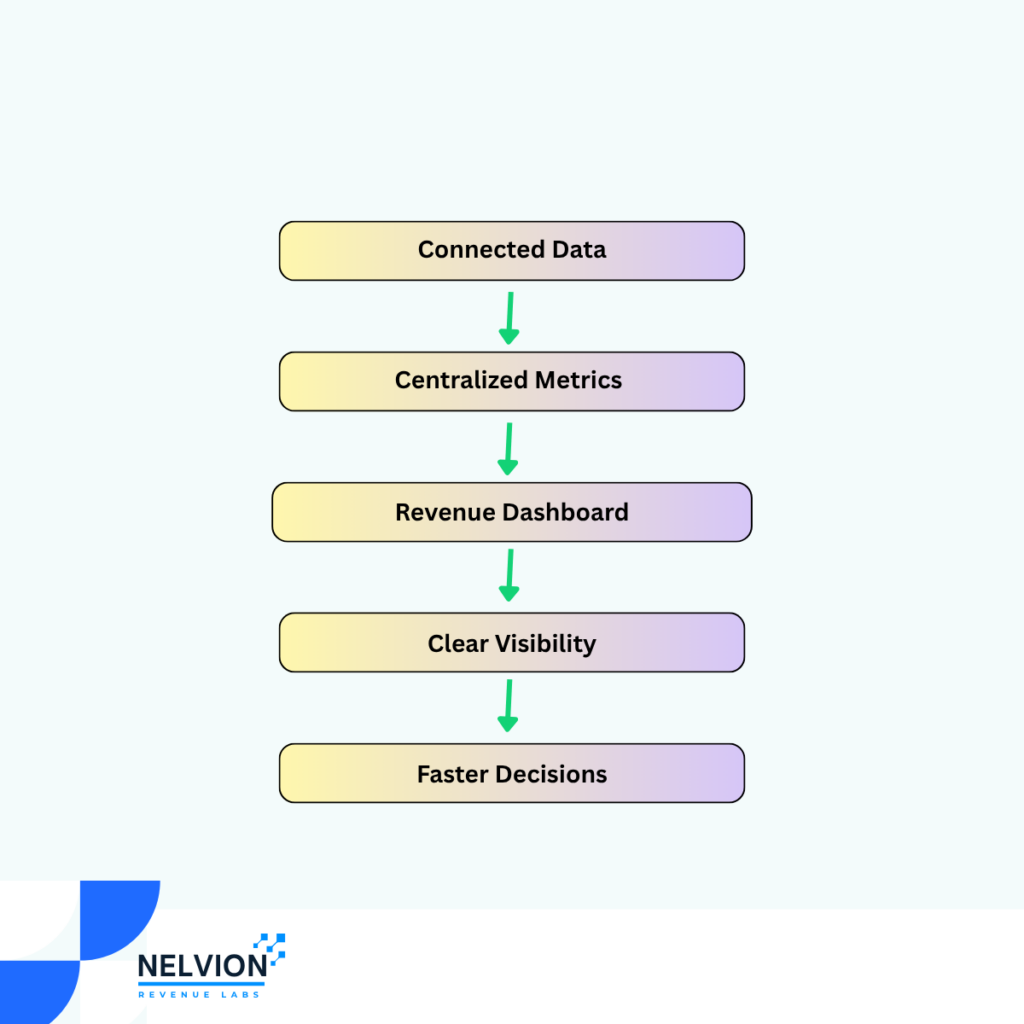
The dashboard automatically updates as new business data is captured, eliminating manual reporting while supporting strategic decision-making.

Technology Stack

Workflow Overview

Objective

Provide business leaders with a centralized dashboard that delivers real-time visibility into revenue performance, sales activity, and operational KPIs.

Workflow

Dashboard Components

Executive Overview

Displays high-level business performance.

KPI Scorecards

  • Total Leads
  • Qualified Leads
  • Open Opportunities
  • Estimates Sent
  • Closed Won
  • Closed Lost
  • Pipeline Value
  • Monthly Revenue
  • Close Rate

Sales Pipeline Dashboard

Tracks opportunity movement through the sales process.

Includes:

  • Deals by Stage
  • Pipeline Value
  • Average Deal Size
  • Win Rate
  • Lost Opportunities

Revenue Dashboard

Monitors financial performance.

Includes:

  • Monthly Revenue
  • Revenue Trend
  • Closed Revenue
  • Forecast Revenue
  • Revenue by Sales Representative

Lead Performance Dashboard

Measures lead generation effectiveness.

Includes:

  • Total Leads
  • Lead Sources
  • Qualified Leads
  • Conversion Rate
  • Lead Response Time

Activity Dashboard

Monitors team engagement.

Includes:

  • Calls Completed
  • Meetings Held
  • Emails Sent
  • Tasks Completed
  • Inspections Scheduled

Forecast Dashboard

Supports strategic planning.

Includes:

  • Expected Revenue
  • Forecast by Month
  • Open Opportunities
  • High Probability Deals
  • Revenue Pipeline

Process Overview

Step 1 – Business Data Collection

Customer activities are recorded within HubSpot CRM.

Examples include:

  • New leads
  • Sales calls
  • Meetings
  • Estimates
  • Closed deals

Step 2 – Data Synchronization

Operational data is synchronized into Airtable and Google Sheets for reporting.

Step 3 – Dashboard Refresh

Looker Studio automatically refreshes the connected data source.

Step 4 – KPI Calculations

The dashboard calculates:

  • Close Rate
  • Pipeline Value
  • Revenue Forecast
  • Lead Conversion Rate
  • Average Deal Value
  • Sales Performance

Step 5 – Executive Reporting

Leadership reviews dashboard insights to monitor business performance and identify opportunities for improvement.

KPIs Monitored

Sales KPIs

  • Total Leads
  • Qualified Leads
  • Open Opportunities
  • Estimates Sent
  • Closed Won
  • Closed Lost
  • Close Rate
  • Average Deal Value

Revenue KPIs

  • Monthly Revenue
  • Forecast Revenue
  • Pipeline Value
  • Revenue by Month
  • Revenue by Sales Representative

Operational KPIs

  • Calls Completed
  • Meetings Scheduled
  • Tasks Completed
  • Lead Response Time
  • Follow-Up Completion Rate

Business Rules

New Lead

Dashboard updates automatically.


Deal Closed

Revenue calculations refresh automatically.


New Sales Activity

Activity metrics update immediately.


Pipeline Changes

Forecast values recalculate automatically.

Business Value

The Executive KPI Dashboard transforms scattered business data into actionable insights, giving leadership a clear view of operational performance and sales health.

Operational Benefits

  • Eliminates manual reporting
  • Centralizes business metrics
  • Improves visibility across departments
  • Enables faster decision-making
  • Tracks performance in real time

Revenue Benefits

  • Better forecasting accuracy
  • Improved pipeline management
  • Faster identification of revenue risks
  • Increased accountability
  • Data-driven growth strategies

Results & Business Impact

The Executive KPI Dashboard provides leadership with a single source of truth for monitoring business performance. By consolidating sales, revenue, and operational data into interactive dashboards, decision-makers gain real-time visibility into pipeline health, forecasting, team performance, and growth opportunities. This enables faster, data-driven decisions while reducing the time spent preparing manual reports.

Ready to Build a Smarter Revenue System?

Whether you’re looking to automate operations, improve customer communication, or gain better visibility into your business performance, Belvion Revenue Labs can help you design systems that support sustainable growth.

Ready to transform your operations?

Book a Strategy Call here and discover how intelligent systems can help your business achieve predictable, sustainable growth.

Ready to Build a Smarter Business?

© 2026 Nelvion Group. All rights reserved.